Explainable AI with Streamlit SHAP Application
This app demonstrates how to use the SHAP library to explain models employing the popular `streamlit` framework for the application front end.
The application is deployed and accessed at:
Additional links are below.
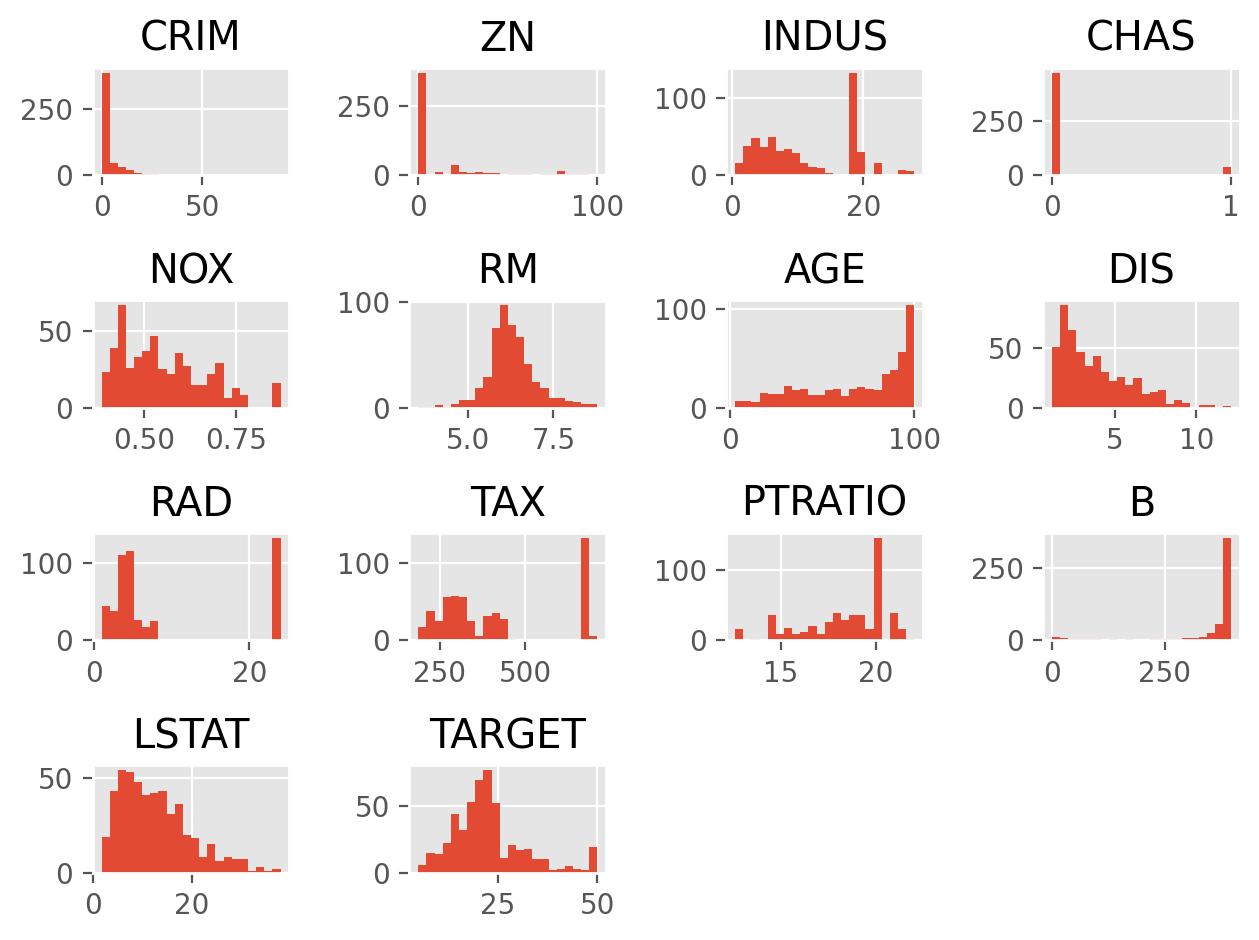
The included images are screenshots of dynamically generated images in the application, some of which you can interact with for additional information across the plots.
Shapley Values for Explanations
Shapley values are an innovative approach that enables machine learning models to assess the individual impact of each feature from a baseline level. This understanding allows us to visualize the significance and the direction of influence for every feature in a given prediction.
Regarded for their theoretical soundness in terms of consistency and accuracy, Shapley values are rapidly becoming the industry standard for explaining feature contributions in model predictions.
For linear and specific tree-based models, exact Shapley values can be computed, providing precise insights. Various approximation techniques are available for other model types, ensuring that this method is adaptable to a wide range of applications.
Project Motivation
In the dynamic field of machine learning, understanding and explaining model predictions is vital for understanding and taking actionable insights from model predictions. This project focuses on Shapley values, a concept from game theory that can be used to interpret complex models.
The primary goal of this project is to provide an intuitive introduction to Shapley values and how to use the SHAP library. Shapley values provide a robust understanding of how each feature individually contributes to a prediction, making complex models easier to understand.
Streamlit is utilized to create an interactive interface for visualizing SHAP (SHapley Additive exPlanations) prediction explanations, making the technical concepts easier to comprehend.
The project also highlights the real-world utility of prediction explanations, demonstrating that it's not merely a theoretical concept but a valuable tool for informed decision-making.
Additionally, SHAP's potential for providing a consistent feature importance measure across various models and versatility in handling diverse datasets is demonstrated.
The Interpretation of Machine Learning Models, aka Explainable AI
A Vital Component for Ensuring Transparency and Trustworthiness
In a world increasingly driven by automated decision-making, comprehending and articulating machine learning models' underlying mechanisms is paramount. This understanding, called model interpretability, enables critical insight into the actions and justifications of algorithmic systems that profoundly impact human lives.
Project Takeaways: Streamlit
Streamlit is an excellent open-source library for creating web applications that showcase machine learning and data science projects. It's easy to use, the documentation is excellent, and it integrates well with the open-source libraries used in this project. However, it may not be the best choice for scalable or enterprise-level applications. Streamlit lacks some of the more advanced customizations available in other web development frameworks. Still, my most significant concerns for using outside smaller projects and prototyping are that state management can be challenging, and performance will be an issue for large datasets or highly complex applications. A problem I ran into was that testing Streamlit apps can be challenging, as it's not a typical Python library.
Overall, I think Streamlit is a great tool to have at your disposal, and the problem it solves, getting something up and running quickly, is what it excels at.
Project Takeaways: SHAP Package
I used the SHAP (SHapley Additive exPlanations) library to interpret complex machine learning models in this project.
The experience with SHAP in the project revealed several advantages. The interpretability it provided turned previously black-box models into useful explanations, making it easy to understand the relative contributions of each feature. Its compatibility with various machine learning models and good integration with `streamlit` allowed for interactive visualizations. Moreover, SHAP's ability to uncover the influence of each feature through easy-to-generate plots is especially useful for explaining predictions to non-technical stakeholders.
However, the implementation was not without challenges. SHAP's computational intensity, especially with larger datasets and complex models, required careful optimization. While SHAP values were insightful, interpreting them can still be challenging, especially for non-technical audiences. Although informative, beautiful visualizations can become overwhelming when dealing with many features, feature selection techniques and careful design can be utilized to keep the user experience interesting.
Links
GitHub Repo: github.com/RodrigoGonzalez/streamlit-shap-app.git
Streamlit App: shap-app.streamlit.app/
Python Library: pypi.org/project/shap-app/

SHAP (SHapley Additive exPlanations)

Visualizing SHAP Values using Tree SHAP

Waterfall SHAP Plot

SHAP Feature Impact - Dot Plot

SHAP Feature Impact - Layered Violin Plot

Feature Analysis - Pearson Correlation Heatmap

SHAP Feature Impact - Violin Plot

Visualize Individual Features with Histograms

