Features >>> Observations
Features >>> Observations: A Project Overview
The need to draw inferences from limited data with numerous variables often arises in various fields, such as business and genomics. The "Features >>> Observations" project targets this challenge, focusing on scenarios where there are more variables than observations, as encountered in areas like genetic research, image processing, text analysis, and recommender systems. This project is older, but I recently updated the code to support Python 3.8+.
Links to the code and homepage are below.
Objective and Data Overview
The project utilizes 300 variables to predict a binary target variable using only 250 observations. The anonymized data is in a CSV file in the data folder. The main goal is to engineer features that maintain predictive power without overfitting—a common issue when features outnumber observations.
Feature Selection
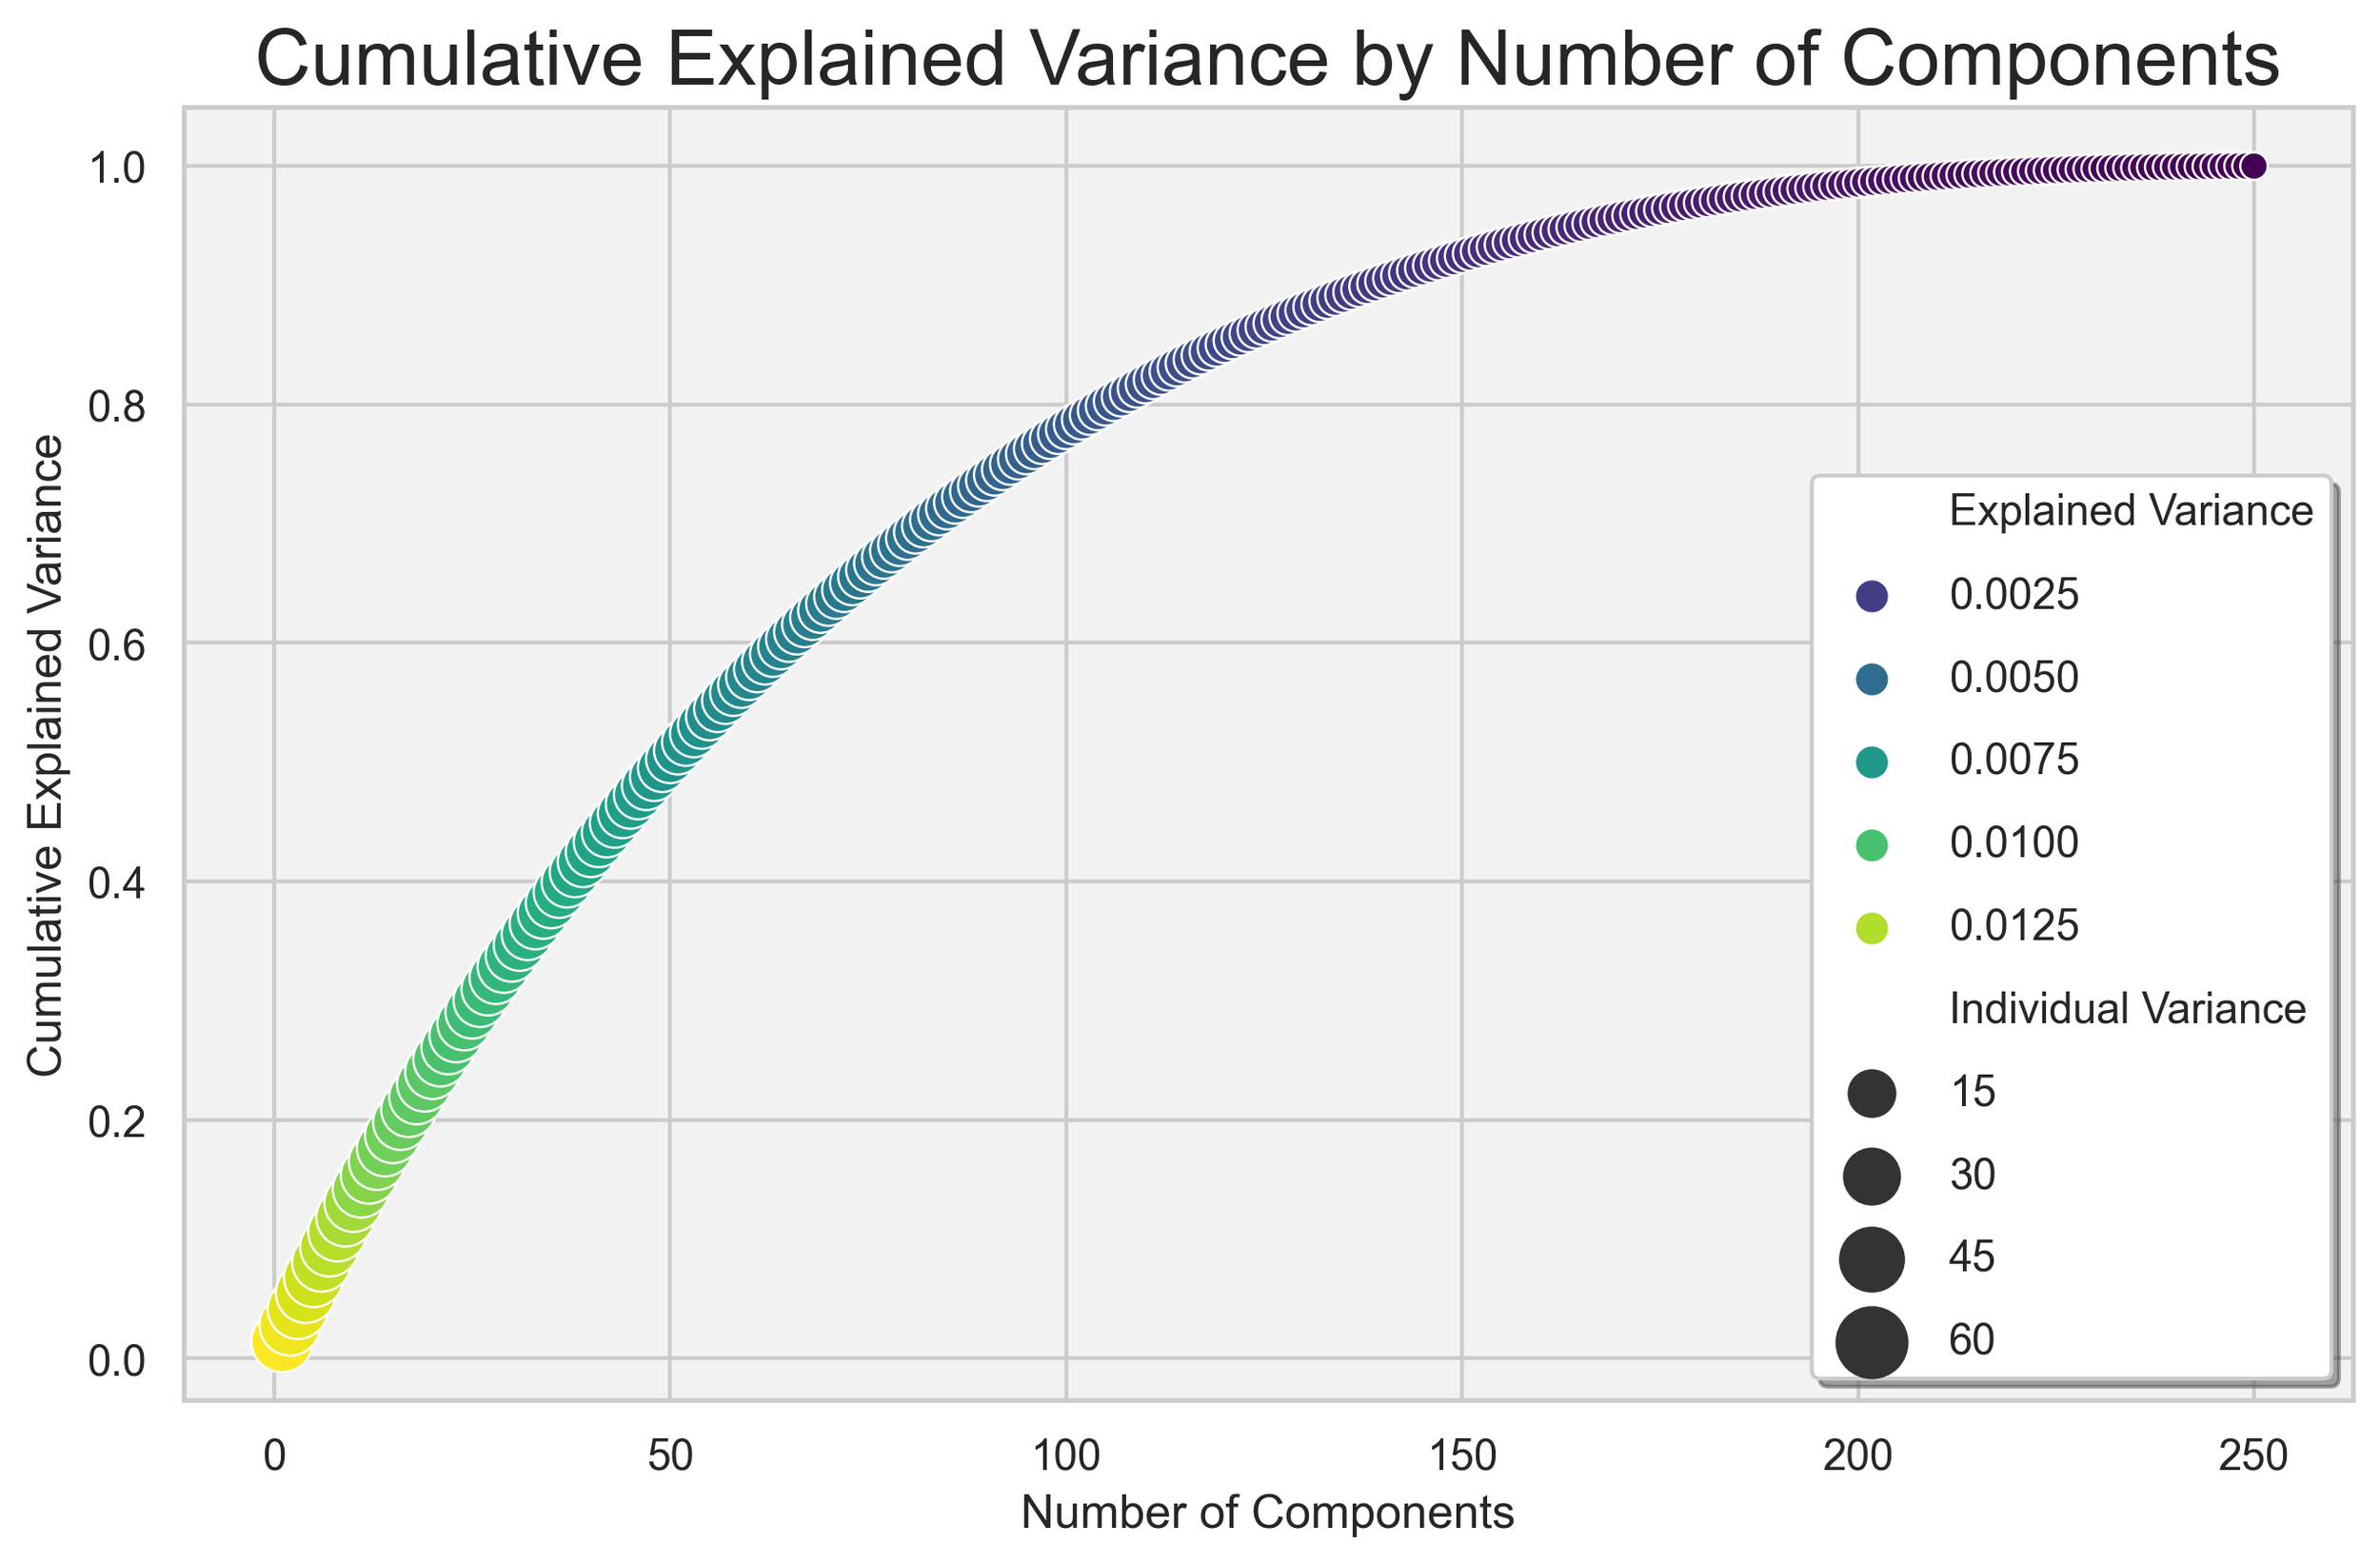
The training data comprises 250 rows and 300 features, making feature selection vital. Techniques such as principal component analysis (PCA), random forests for feature importance, and logistic regression model coefficients have been employed. The selected features were standardized, and in the case of PCA, 90% of the variation in the data was explained by approximately 150 features.
Tools Used
1. Python: The programming language for this project.
2. sklearn: Scikit-Learn, machine learning modules.
3. AWS: Amazon Web Services, for large instance model fitting.
4. XGBoost: Gradient boosting library.
Model Exploration
The project explored various classification algorithms, including Logistic Regression, ensemble methods (random forest, extremely randomized, bagging, adaboost, gradient boost), passive aggressive algorithms, Gaussian Naïve Bayes, Support Vector Machines, and K Nearest Neighbors.
Model Selection
The selection process involved a detailed strategy using nested cross-validation with stratified KFolds and grid searches. Different scoring methods were explored, including accuracy, ROC AUC, f1, and log-loss.
Solution and Best Models
The final solution was obtained using the entire training data set, with models like Bagging Classifier, Extremely Randomized Trees Classifier, Logistic Regression, Nu-Support Vector Classification, Random Forest, and C-Support Vector Classification. Predicted probabilities were averaged to achieve the final results.
Conclusion
This challenge provided insights into building a model with limited data and extensive features. The final model achieved an AUC of 0.97, showcasing the effectiveness of feature selection and model averaging. The project emphasizes the significance of data engineering and modeling in handling complex datasets with more features than observations.
Acknowledgments
The project acknowledges the valuable resources and algorithms provided by scikit-learn and the insightful work by Cawley, G.C.; Talbot, N.L.C. on avoiding over-fitting in model selection.
Homepage and Repository Links
- Homepage: rodrigogonzalez.github.io/more-features-less-rows/
- GitHub Repository: github.com/RodrigoGonzalez/more-features-less-rows

Homepage

Cumulative Explained Variance of Each Component Using PCA
The figure illustrates the cumulative explained variance as a function of the principal components derived from Principal Component Analysis (PCA) applied to the dataset. The x-axis represents the number of principal components, whereas the y-axis indicates the cumulative explained variance. This relationship reveals how adding additional components contributes to capturing the underlying variance in the data.

